|
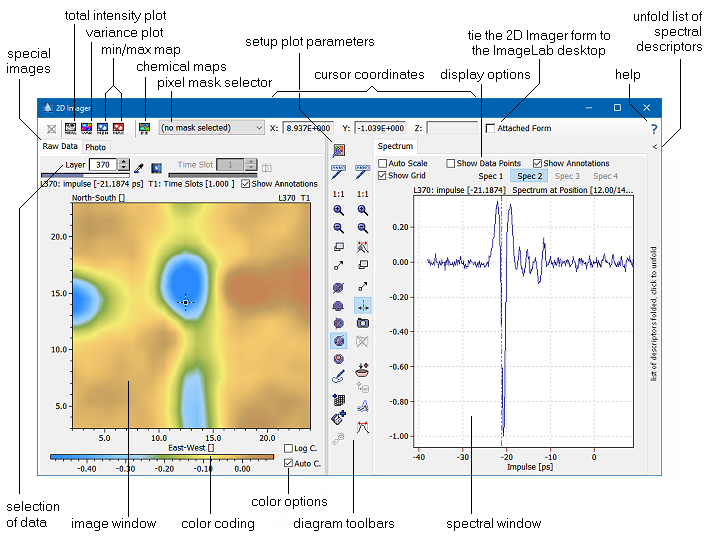
This window is the central tool of Epina ImageLab and cannot be closed (only minimized). The 2D Imager window serves several purposes: (1) to display spectra of selected pixels; (2) to display an image corresponding to a particular wavelength, mass or physical property, (3) to display special images such as the total intensity plot, (4) to collect images calculated by statistical methods (for example, principal component based images, or images calculated by user supplied modules), and (5) to browse through all images by displaying a video either along the spectral or along the time axis of the data. Furthermore it enables the user to display sample photos in a separate tab.
| Hint: |
The 2D Imager can be operated in two modes: if the check box "2D Imager tied" is ticked off, the form of the 2D Imager is part of the Epina ImageLab desktop and thus confined to the Epina ImageLab form. If this check box is unchecked, the 2D Imager is converted into a floating form which can be moved freely around on the screen. This option is especially useful in multi-screen configurations. |
Selection of Data
 The selection of data to be displayed can be achieved in several ways depending on the type of image: spectral data (shown in the right diagram of the 2D Imager) can be selected by moving the location cursor in the left pane (raw data image, photo, or one of the special images, see figure above).
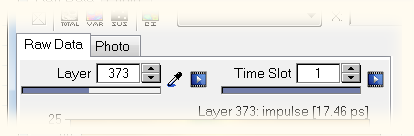
Image data can be selected by either moving the spectral cursor in the right pane (see figure above), or by selecting the corresponding layer.
The time slot control specifies the particular time slot of which the image and the spectral data are plotted.
Video Option
The video option allows to automatically browse through the images either along the spectral or the time axis. As the images are displayed in quick succession (typically between 10 and 100 ms) the impression of an animated video is created.
Diagram Toolbars
The diagram toolbars contain the following buttons:
 |
Adjust the image settings (colors, pixel display, isolines, contour plot). Please note that the color scale and color palette can be adjusted by direct interaction with the color scale. |
 |
Open the annotation tool in order to add or edit annotations. |
 |
Adjust the zoom factor to display the entire image/spectrum. The (left) image zoom button always affects all hyperspectral images together. |
 |
Zoom in on the image/spectrum. The (left) image zoom button always affects all hyperspectral images together. |
 |
Zoom out of the image/spectrum. The (left) image zoom button always affects all hyperspectral images together. |
 |
Zooms the spectrum to a fixed resolution of 200 data points along the x axis. The magnified spectrum will be shifted such that the cursor position is in the center of the chart. |
 |
Zoom into the image or spectrum by drawing a rectangular area which is enlarged to fill the data window after releasing the mouse button. The (left) image zoom button always affects all hyperspectral images together. |
 |
Pan the image/spectrum by dragging it with the mouse. The (left) image pan button always affects all hyperspectral images together. |
 |
Display a user-defined cross section. In order to adjust the cross section you can move the two reference points of the cross sectional line. The intensities along this line are displayed in the spectral window. Please note that the cross section is projected either on the x- or y-axis, depending on the slope of the cross sectional line. |
 |
Show a horizontal cut through the image. |
 |
Show a vertical cut through the image. |
 |
Display the spectrum of a particular pixel. |
 |
Display the average spectrum of a circular region around a particular pixel. Please note that you can adjust both the size of circular region and the color of the confidence band by right clicking this button. |
 |
Add the current image to the image stack |
 |
Display the average spectrum of a user-defined region. After the user has drawn the boundary of the region all spectra within that region are averaged. |
 |
Switch to cursor mode (spectrum only). |
 |
Create a snapshot of the currently visible spectrum. |
 |
Add the current spectrum to the spectral collection. In the case of a lasso region you have the choice to add the mean spectrum of the region or a number of randomly selected individual spectra.
|
 |
Delete the collection of snapshots. |
 |
Set a bookmark at the current image and location. |
 |
Toggles the mode of display of spectral collection entries. Clicking this button cycles through several different modes controlling how the positions of spectral collection entries are indicated: [none] - [position only] - [caption with color coded types] - [collection id with color coded types] - [caption with color coded classes] - [collection id with color coded classes]. |
 |
Calculates the mean spectrum over all pixels which are currently visible and shows it in the spectral window. The standard deviation is indicated by two colored bands around the mean spectrum. Please note that you may also display the mean spectrum of a limited region of an image by activating the "average spectrum" button (). |
 |
Activates the vertical cursors for measuring positions and distances |
Special Images
The 2D Imager allows the user to collect special images which may have been created by various statistical techniques. Many of the built-in methods offer an "add to 2D Imager" button ( ) which transfers the currently visible image of a particular window to the 2D Imager. Please note that the images collected in the Imager are not bitmaps ("picture") but images based on the underlying data matrices which are copied into the Imager to create the corresponding image. ) which transfers the currently visible image of a particular window to the 2D Imager. Please note that the images collected in the Imager are not bitmaps ("picture") but images based on the underlying data matrices which are copied into the Imager to create the corresponding image.
Please read the section on special images for further information.
Context Menus
The charts of the 2D Imager provides various commands which are available from the respective context menu:
| Command |
Chart |
Explanation |
| Annotate |
Raw Data Image
Spectrum |
Adds an annotation using the current cursor position. After clicking "Annotate" a caption edit window is displayed which can be used to edit the caption to be displayed with the annotation (see the section Annotation Tool for details on the annotation captions). Currently four different kinds annotations are supported: (1) in the spectral diagram you can add the current spectral cursor as an annotation; in the raw data image you can add (2) a point annotation, (3) a lasso annotation and (4) a distance annotation. Which type of annotation is added depends on the mouse action buttons. |
| Set Bookmark |
All charts |
Adds the current display to the list of bookmarks. |
| Copy to Clipboard |
All charts |
Copies the current image or chart into the Windows clipboard |
| Copy to Image Stack |
All charts |
Copies the current image into the image stack |
| Save Image as File |
Raw data image
Image repository |
Stores the currently displayed image as a file on the harddisk. Saving an image to the disk provides you with more options, allowing you to adjust the caption and the size of the image, to exclude or include the color scale, or to specify the background color of the image. See the section Save Image to Disk for more. |
| Export Data |
All charts |
Exports the data of the current image or chart as a text file. The format of the text file is compatible to the DataLab ASC format. Please note the subtle difference from the command "Send to DataLab": while "Export Data" can be executed anytime, no matter whether DataLab is installed on the system, "Send to DataLab" can only be executed when DataLab is installed and running. In addition the command "Export Data" allows the user to specify the file name of the exported data. |
| Send to DataLab |
All charts |
Sends the data of the current image or chart to DataLab. DataLab has to be installed and running in order to be able to execute this command. This command is especially useful if you want to process the numeric values of the image using statistical methods not available in Epina ImageLab. |
| Create a Mask from Current Image Data |
Raw data image
Image repository |
Uses the current image and allows to create a pixel mask by opening the mask creator. |
| Add Red Pixels to Pixel Mask |
All charts |
In the case of an image showing the results of the analysis of suspicious pixels, the user may copy the red (suspicious) pixels into a pixel mask. The copying is always additive, if more than one pixel mask is available, the user has to select one from the list of mask displayed after clicking this command. |
| Add Snapshots to Spectral Collection |
Spectral Snapshots |
Appends all snapshot spectra to the spectral collection. The snapshot spectra are added including their class assignment. |
| Remove Selected Snapshot Spectrum |
Spectral Snapshots |
Removes the selected spectrum from the collection of snapshots. |
| Assign a Class Number to the Selected Spectrum |
Spectral Snapshots |
Changes the class number (and color) of the selected snapshot spectrum. After clicking this command you can select a different class from the table of classes. Newly stored snapshot spectra always belong to class zero. |
| Detect Particles |
Raw data image
Image repository |
This starts the Particle Detector of Epina ImageLab. After clicking this command you have to set an intensity threshold which controls the discrimination between particles and background. After setting the threshold the regions showing intensity values above (or below) the threshold are analysed. The results are displayed in the Particle Editor. |
| Copy Distance to Clipboard |
Raw Data Image |
Copies the distance between the two reference points to the Windows clipboard. This option is only available if the cross section is activated (button pressed). |
| Path Length Measurements |
all charts |
Copies the current image to length measurement tool and starts it. |
|
 Visualisation of Data

