Home  Image Processing Cluster Analysis Hierarchical Cluster Analysis Image Processing Cluster Analysis Hierarchical Cluster Analysis |
||||||||
See also: k-Means Clustering, Vertex Component Analysis (VCA), Fuzzy c-Means Clustering
 |
||||||||
  |
||||||||
Hierarchical Cluster Analysis |
||||||||
|
The hierarchical cluster analysis provides an efficient means to find out any clusters in the spectral space. After calculating the cluster analysis the user can assign different class numbers to individual parts of the resulting dendrogram. The classes are indicated by different colors which can be adjusted by the user using the command Setup/Class Colors. Please note that for larger images the calculation of the dendrogram is rather time consuming and requires a high amount of memory. The memory requirements for a square image of n pixels are approximately 8n4 bytes, which, for example, comes to about 800 MB for a 100x100 image. Epina ImageLab issues a warning message if the number of pixels exceeds a limit causing excessively high computation times. In order to speed up calculations for preliminary analyses the user may select a reduced dataset using pre-calculated cluster centers. The reduction of the dataset works according to the following idea: in the first step the distances of all spectra (pixels) are calculated and those which are closer to each other than a predefined part are combined into mini clusters which are represented by their average spectra. This way the the number of spectra submitted to the final cluster analysis is reduced to a manageable number (less than 10000). The sensitivity of the creation of the mini clusters can be controlled by the parameter "Percentile MinDist" which defines the percentile of all distances which are not regarded significant. A higher value of "Percentile MinDist" creates less mini clusters.
|
||||||||
 Image Analysis > Cluster Analysis > Hierarchical Cluster Analysis
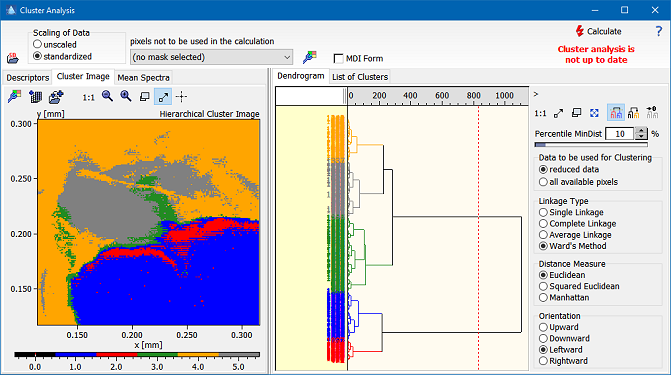
 ), or by assigning individual subtrees (button
  ). The assigned clusters are displayed in the cluster image, the average spectrum of each cluster is displayed in the tab