Home  Image Processing Vertex Component Analysis Image Processing Vertex Component Analysis |
||||||
See also: Principal Component Analysis (PCA), Cluster Analysis (HCA), k-Means Clustering, VCAGui, Calculate, ShowEndmemberImage
 |
||||||
  |
||||||
Vertex Component Analysis |
||||||
|
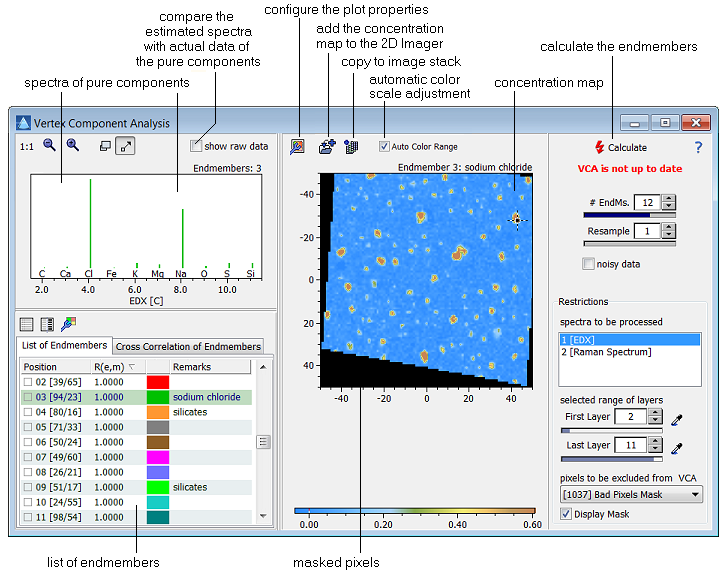
The vertex component analysis (VCA) is a method for unsupervised endmember extraction from hyperspectral data [Nascimento 2005] assuming that the data is a linear mixture of pure components (spectra). VCA assumes the presence of pure pixels in the data. It extracts a predefined number of pure components and estimates both the pure spectra and the concentration maps of the found components. VCA always works on raw data (no spectral descriptors are used) and is applied separately to a particular spectral type in the case of multisensor images. In order to speed up calculations the user can define a resampling factor which reduces the number of used wavelengths.
After the VCA has been completed the list of found endmembers is shown in the table at the lower left. The table contains the ID number of the endmember, the pixel associated with it (pixel coordinates in square brackets), its correlation with the actual spectrum of the pixel, the color which is used to display it and an optional remark added by the user. In order to compare multiple endmembers you can tick off the endmembers of interest. This will display the selected endmembers on top of each other. Further you can check the correlation among the endmembers by looking at the cross correlation table. Those pairs of endmembers which have a correlation significantly higher than 0.3 are indicated in red color, the endmembers showing a significant correlation less than -0.3 are displayed in blue (the level of significance is by default 5%, but can be adjusted). Clicking any of the correlation values automatically displays the corresponding pair of endmembers.
|
||||||
 Image Analysis > Vertex Component Analysis