
Application Example: Enrichment in a Dried Droplet
The following example shows the different kinds of enrichment of cations in drying droplets. In this particular example, droplets of an aqueous solution of lithium and strontium salts have been dried on filter paper, followed by the analysis of the spatial distribution of these elements (data courtesy W. Nischkauer [Nischkauer 2014]).
Two well-known effects are immediately visible: (1) the concentration increases considerably near the edge of the dried droplet, and (2) the different diffusion coefficients of lithium and strontium ions result in different relative enrichments along the edge of the ring.
In order to show this, the dried droplet has been scanned using laser ablation and analyzed by optical emission spectroscopy at characteristic wavelengths (LA-ICP-OES: laser ablation - inductively coupled plasma - optical emission spectroscopy). The first effect can be seen in Figure 1 which displays both the lithium image of the droplet (left) and its cross section (right). The concentration near the edge is more than twice the concentration at the center of the droplet.
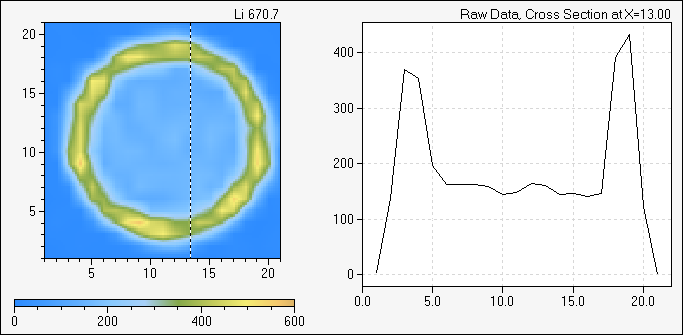 |
| Fig. 1: lithium vs. strontium. Data courtesy W. Nischkauer, Vienna Univ. of Technology, Vienna. |
The second effect can be shown by establishing a linear regression model of lithium vs. strontium, plotting the residuals for each pixel as a contour plot. Figure 2 clearly shows the distinct behavior of lithium and strontium (right). The blue outer part of the circular shape indicates the (relative) depletion of lithium, the red inner part of the ring shows the relative enrichment of lithium in this zone.
A look at the regression model (left) underpins the same fact. Two groups of pixels can be discerned indicating different ratios of lithium and strontium.
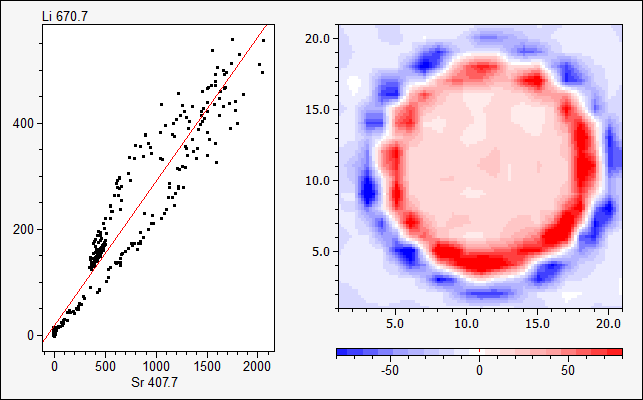 |
| Fig. 2: The plot of lithium vs. strontium clearly shows the different behavior of the two ions during the drying of the droplet. Data courtesy W. Nischkauer, Vienna Univ. of Technology, Vienna. |