|
| Command: |
Tools > Recalibration > Recalibrate Spectra |
Sometimes it is necessary to (re)calibrate the spectral data. For example, when importing data which has been exported in ENVI format from Bruker Opus(TM), the exported dataset does not contain any spectral information. Thus after the data import the spectral scale reflects only the index numbers of the layers of the image.
In principle, the calibration is quite simple. You have to specify a few pivot points and their exact wavelengths (or wavenumbers, masses, etc.) and the order of the polynomial which is to be used for the calibration. The calibration tool then calculates the calibration function and displays it, and its results. If the new calibration is OK then you apply this new calibration to the dataset by clicking the "Apply" button.
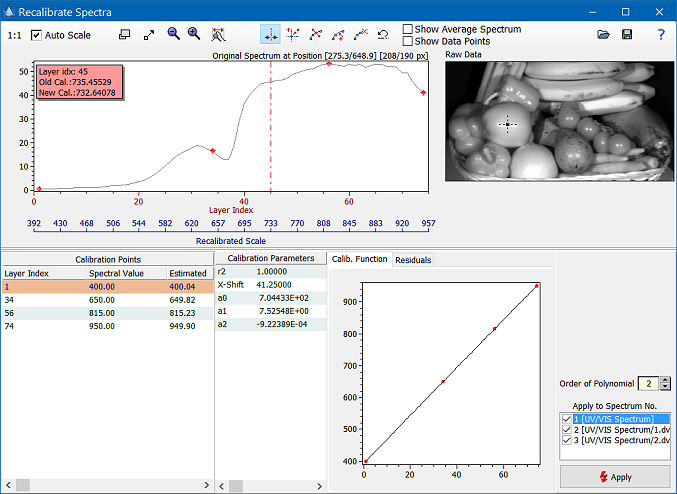
The recalibration tool has five areas: in the top half of the tool you find the spectrum and the corresponding image. Below you find a list of the calibration points, the calibration parameters calculated from the calibration points and a visual representation of the calibration function.
| How To: |
Please follow these steps to spectral calibration:
- Add as many calibration points as you think is appropriate. Please note that the required minimum number of calibration points is one higher the order of the polynomial. For example, for a linear calibration (order = 1) you need at least 2 calibration points.
- Enter the true wavenumbers/wavelengths/masses of the calibration points in the column "Spectral Value" of the list of calibration points (bottom left table).
- Select a suitable calibration polyomial. As a general rule, keep the order of the polynomial as low as possible.
- Move the spectral cursor in the spectrum at the top left area to distinct features of your spectrum. The red insert shows both the old and the new spectral value. Check that the new spectral value is correct for all peaks you know of the true wavelength.
If the calibration is correct, click the "Apply" button.
A few hints:
- The more calibration points you enter the better the calibration will be (provided that you know the correct true values).
- The residuals for real calibration data will never be zero. Thus check the residuals. If they are zero you have to have a good reason to accept this.
- A high goodness of fit (r2 close to 1.0) is not necessarily an indication of a correct calibration (see standard textbooks on linear regression for details); the goodness of fit can be almost 1.0 even in the case of a corrupt calibration (especially if the spectral device exhibits a high accuracy, for example, high resolution mass spectrometry).
|
|
 Tools
Tools 

