|
The debugger is integrated into the Script Editor and allows to single-step through the script and watch its actions. In addition, the variable inspector provides a simple and efficient means to follow the values of selected variables during the execution of a script.
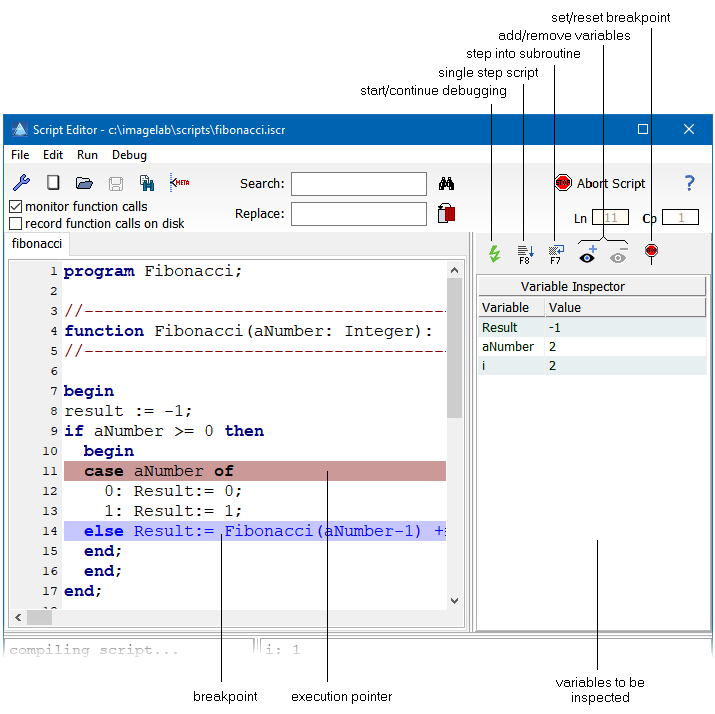
The debugging can be started by clicking the "start debugging" button ( ). This switches the script into debugging mode and sets the execution pointer to the first line of the script. Next you can either single-step the script by pressing F8 or the corresponding button ( ). This switches the script into debugging mode and sets the execution pointer to the first line of the script. Next you can either single-step the script by pressing F8 or the corresponding button ( ), or you can set one or several breakpoints and continue the debugging execution by clicking the "continue debugging" button ( ), or you can set one or several breakpoints and continue the debugging execution by clicking the "continue debugging" button ( ). The script will be executed until it reaches a breakpoint. ). The script will be executed until it reaches a breakpoint.
In order to select certain variables for display in the variable inspector you can either click the "add variable" button ( ) and enter the name of the variable, or you can set the text cursor into the variable name and press Ctrl-F7. ) and enter the name of the variable, or you can set the text cursor into the variable name and press Ctrl-F7.
Breakpoints can be set by moving the text cursor to the corresponding script line and clicking the "set breakpoint" button ( ) or by pressing Ctrl-F8. ) or by pressing Ctrl-F8.
| Hint: |
Please note that debugging is only possible for the script loaded into the first tab of the multi-tab editor. If you want to debug a script loaded into another tab you have to move this script to the first tab by using the context menu entry "Move to First Tab" (right-lick the tab caption). |
Shortcut Keys and Buttons
| Shortcut |
Button |
Action |
| F4 |
|
run the program until the current cursor position is met |
| F7 |
 |
step into a subroutine during debugging |
| F8 |
|
step through code during debugging (without tracing into subroutines) |
| F9 |
 |
normal mode: compile and run the script |
| |
|
switch into debug mode, and start the script, halt the execution at the first line of the scrip |
| F9 |
|
debug mode: continue running the script until the next breakpoint |
| Ctrl+F2 |
 |
stop the debugging of a script |
| Ctrl+F7 |
|
add the identifier at the current cursor position to the variable inspector |
| |
 |
remove the selected identifier from the variable inspector |
| Ctrl+F8 |
|
set/reset a breakpoint at the current cursor position |
Context Menu of the Variable Inspector
| Command |
Action |
| Copy all Variables to Clipboard |
Copies the entire set of variables listed in the variable inspector to the clipboard; the variable identifiers and their respective values are separated by a tab |
| Paste Variables from Clipboard |
Clears the variable inspector and fills it with the variables stored in the clipboard. This command assumes that the variable identifiers are stored linewise. All characters after a tab character are ignored (thus pasting only the names and no values) |
Context Menu of the Editor Tabs
| Command |
Action |
| Close Page |
Closes the currently selected script. |
| Close All Other Pages |
Closes all editor windows but the current one. |
| Read Only |
Temporarily switches the corresponding editor in read-only mode (for example, in order to protect the script from altering it unintentionally). If you want make the read-only mode permanent, you have to insert the corresponding meta tag (#READONLY TRUE). |
| Move to First Tab |
Moves the current script to the left, so that it becomes the first tab in the editor windows. Moving a script to the first tab is required if you want to debug the script. |
Context Menu of Editor Window
| Command |
ShortCut |
Action |
| Run To Current Line |
F4 |
Run the program until the current cursor position is met. F4 can only be applied if the script is in debugging mode (press the button to start debugging). |
| Add Watch Value |
Ctrl-F7 |
Add the selected text to the variable inspector. |
| Toggle Breakpoint |
Ctrl-F8 |
Set/reset a breakpoint at the current cursor position |
| Remove all Breakpoints |
|
Delete all breakpoints in the program. |
| Hint: |
Please note that the CPU is active during the debugging phase, even if the execution is stopped. Thus leaving a script in debugging mode for a longer time may drain the batteries of your computer. |
|
 Script Language