Home  Tools Fourier Analysis of Spectra Tools Fourier Analysis of Spectra |
||||||
See also: FFT, Filtering of Spectra, FFT Based Filtering of Spectra
 |
||||||
  |
||||||
Fourier Analysis of Spectra |
||||||
|
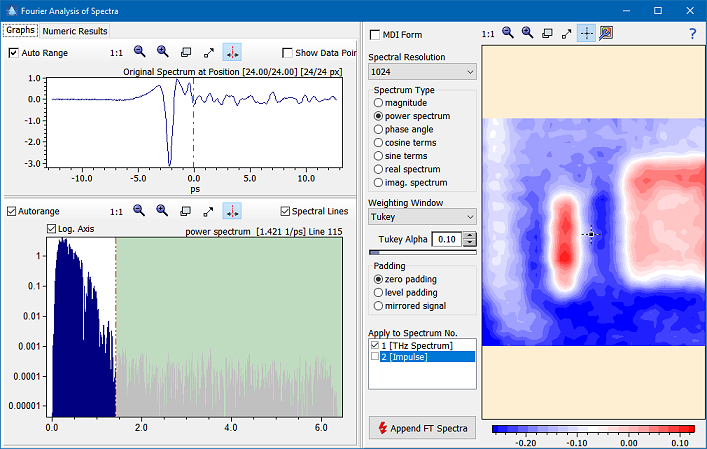
The command Tools > Fourier Analysis of Spectra enables the analysis of the spectral components by applying a Fast Fourier Transform (FFT) on the signal. Moving the mouse cursor in the image selects the corresponding pixel and displays both the spectrum and its Fourier transform. The results of the FFT are available in tabular form as well (tab "Numeric Results"). Further, you can append the FFT transform to the data cube (if at least one spectral group is available).
| ||||||
 Tools > Fourier Analysis of Spectra