Home  Visualisation of Data Visualisation of Data  3D Surface Plot 3D Surface Plot |
||||||
 |
||||||
3D Surface Plot |
||||||
|
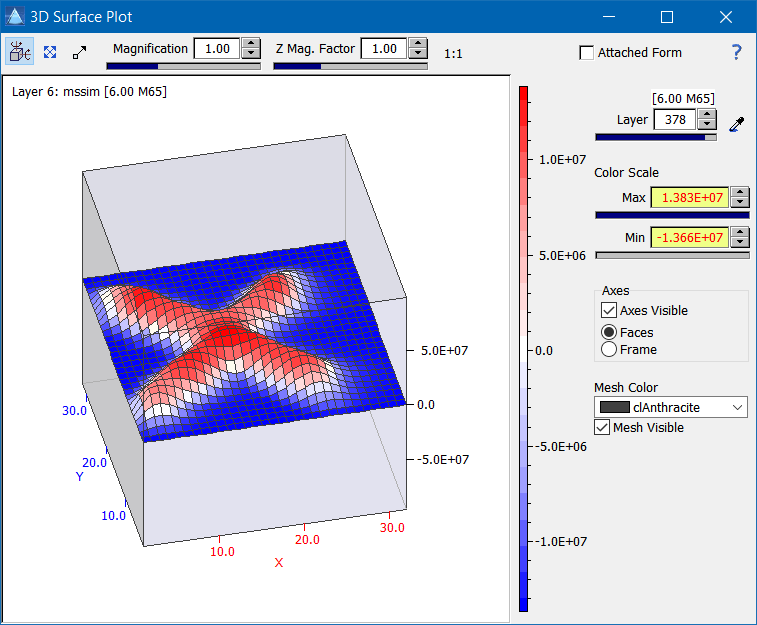
The feature "3D surface plot" provides a simple means to visualize the data of individual layers by constructing a rotatable surface plot. This plot can be especially useful to visualize the often hardly recognizable differences in intensity within a layer, because color encoded 2D maps exhibit only a limited dynamic range.
|
||||||


 Tools > 3D Surface